Container metrics
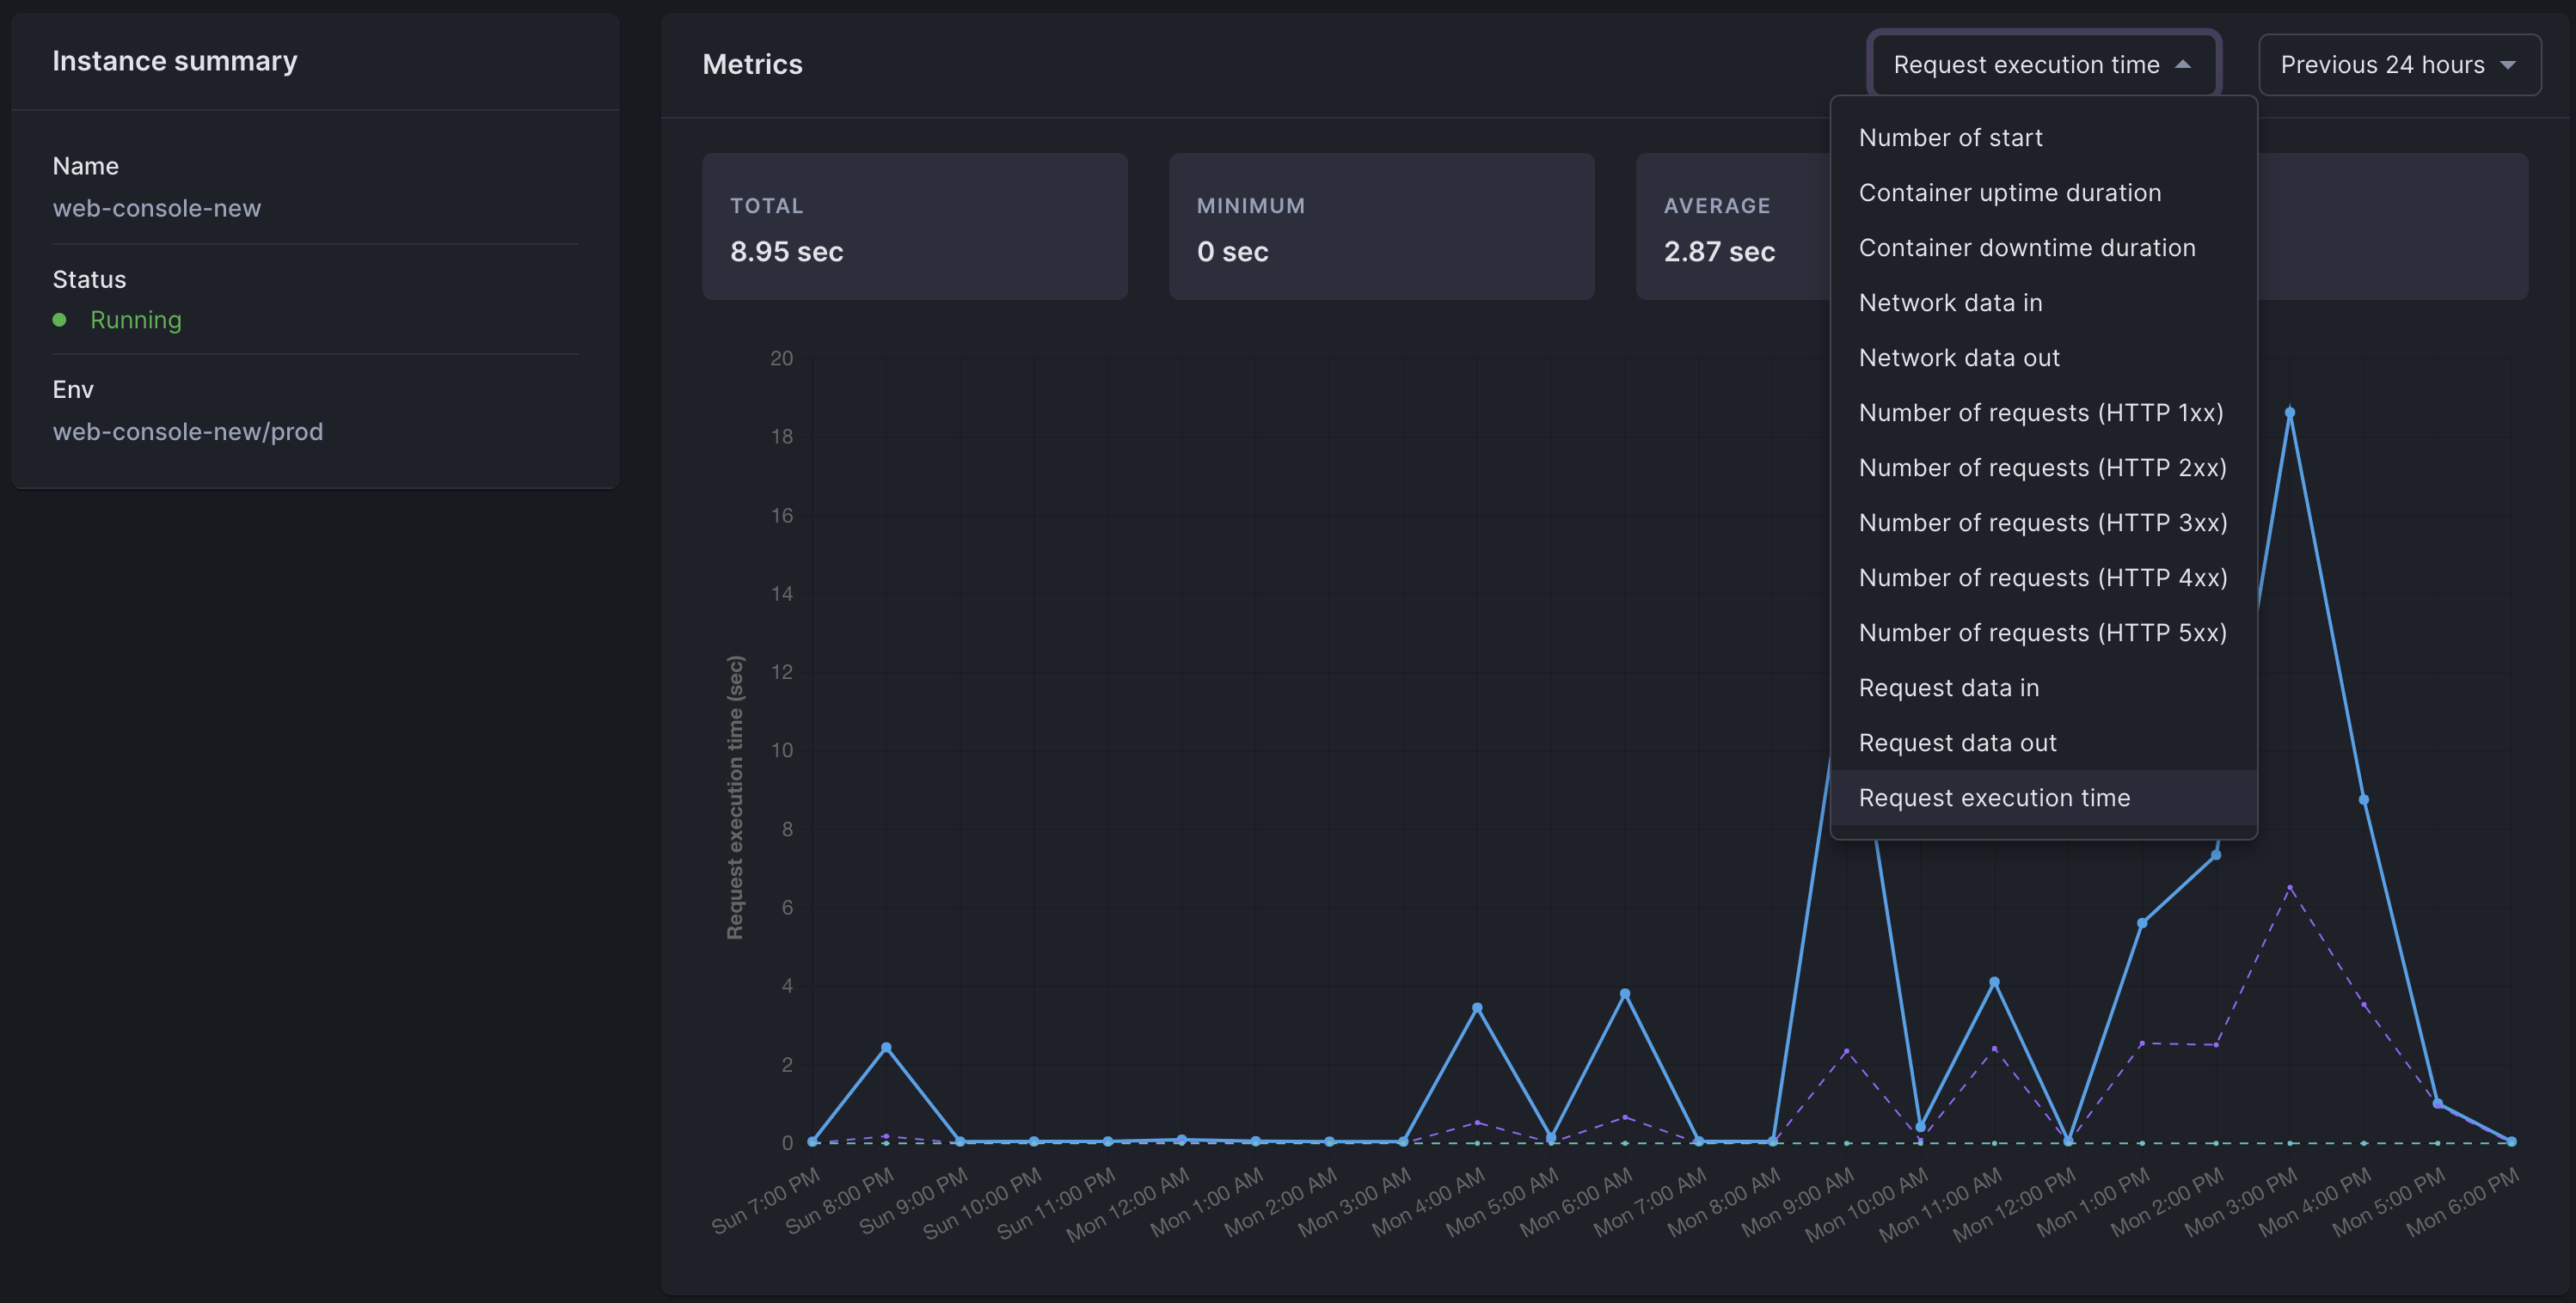
The platform provides you with a set of metrics to monitor your containers directly from the console, on the runner view.
Every metric is provided for a given container over a period of an hour or a day. You can access them for the last 24 hours, the last 7 days or the last 30 days (metrics above 30 days are erased).
Available Container Metrics
- Number of 2XX requests
- Number of 3XX requests
- Number of 4XX responses
- Number of 5XX responses
- upTime and Downtime (in seconds)
- Number of restarts (ex: after a deploy, or after a bug in the container that kills it)
- Request execution time (min, max and average per request in seconds)
- Request Data-in volume (data received min, max and average per request in bytes)
- Request data-out volume (data sent min, max and average per request in bytes)
Extensions
ℹ️
Extensions are only available on request and could implies an additional fee. Please contact sales@scaledynamics.com.
On request it is possible to
- connect a Prometheus (opens in a new tab) system to integrate your metrics with your monitoring system (eg. Grafana).
- get other specific metrics
- extend the retention of the metrics (3 months, 1 year or more)
- access metrics using an API key to access them
If you're interested by these extensions contact sales@scaledynamics.com